Journals > > Topics > Optics in Computing
Optics in Computing|34 Article(s)
Progressive Training Scheme for Recognition Error of Optical Neural Networks
Pengxing Guo, Zhengrong You, Weigang Hou, and Lei Guo
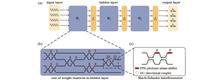
ObjectiveThe optical neural network (ONN) based on the Mach-Zehnder interferometer (MZI) has widespread applications in recognition tasks due to its high speed, easy integration, scalability, and insensitivity to external environments. However, errors resulting from manufacturing defects in photonic devices accumulate as the ONN scale increases, consequently diminishing recognition accuracy. To address the decreased accuracy caused by MZI phase errors and beam splitter errors in the MZI-based ONN (MZI-ONN), we introduce a progressive training scheme to reconfigure the phase shift of the MZI feedforward ONN.MethodsDue to the cascaded arrangement of MZIs in MZI-ONN (Fig. 1), the progressive training scheme gradually determines the phase of each column within a certain number of iterations. Based on determining the phase, the phase error and beam splitter error carried by the MZI are considered. After starting the iteration again, the phase value of the undetermined phase shifter is utilized to offset the phase error and beam splitter error carried by the fixed MZI. This training process is repeated until the last column of the grid, and the phase values obtained by progressive training can counteract the inaccuracies caused by imperfect photonic devices, thereby improving the recognition accuracy of MZI-ONN. Importantly, this progressive training scheme reduces inaccuracies caused by optical components without altering the topology of MZI-ONN.Results and DiscussionsWe employ the Neuroptica Python simulation platform to construct a cascaded MZI-ONN and validate the efficacy of the proposed training scheme. The error range of the MZI phase shifter is set between 0.05 and 0.10, with a fixed beam splitter error value of 0.10. Results demonstrate that the proposed progressive training scheme based on the Iris dataset enhances the recognition accuracy of a three-layer 4×4 MZI-ONN from 32.50% to 96.65% (Fig. 5). During the application in the MNIST dataset, the accuracy of three-layer ONNs with grid scales of 4×4, 6×6, 8×8, and 16×16 is elevated by 2.00%, 22.33%, 37.00%, and 36.25%, respectively (Fig. 7), significantly improving the error-resistance performance of the ONN. To substantiate the advantages of the proposed method, we compare the proposed progressive training optimization scheme with traditional genetic algorithm (GA) training, the error correction scheme using a redundant rectangular grid (RRM), and a hardware optimization scheme. Notably, compared with the RRM-based error correction scheme and hardware optimization scheme, the proposed scheme exhibits the capability to conserve more MZI units and detectors. Furthermore, while the traditional GA training scheme enhances the recognition accuracy of the Iris dataset with four features and the MNIST dataset with eight features by 23.10% and 32.40%, respectively, the proposed scheme achieves improvements of 64.15% and 37.00% under the same scale (Table 2). In a comprehensive evaluation, this scheme enhances the recognition accuracy of the ONN without augmenting hardware costs and demonstrates superior error-resistance performance.ConclusionsWe introduce a progressive training scheme designed to alleviate recognition errors in MZI-ONN. The scheme improves the recognition accuracy of the ONN without modifying the topology grid structure and parameters, thus causing no additional hardware costs. To validate the effectiveness of this scheme, we conduct simulations by adopting the Neuroptica Python simulation platform as a proof of concept. The error parameters of photon devices are pre-trained, and the MZI-ONN phase is fixed based on the number of iterations. Subsequent phases are then utilized to compensate for errors introduced by the fixed phase. Simulation analyses are performed on ONNs of scales 4×4, 6×6, 8×8, and 16×16, which demonstrates that the proposed progressive scheme can enhance the recognition accuracy of MZI-ONN by up to 64.15% with an average increase of 39.93%, improving the error-resistant performance of MZI-ONN. ObjectiveThe optical neural network (ONN) based on the Mach-Zehnder interferometer (MZI) has widespread applications in recognition tasks due to its high speed, easy integration, scalability, and insensitivity to external environments. However, errors resulting from manufacturing defects in photonic devices accumulate as the ONN scale increases, consequently diminishing recognition accuracy. To address the decreased accuracy caused by MZI phase errors and beam splitter errors in the MZI-based ONN (MZI-ONN), we introduce a progressive training scheme to reconfigure the phase shift of the MZI feedforward ONN.MethodsDue to the cascaded arrangement of MZIs in MZI-ONN (Fig. 1), the progressive training scheme gradually determines the phase of each column within a certain number of iterations. Based on determining the phase, the phase error and beam splitter error carried by the MZI are considered. After starting the iteration again, the phase value of the undetermined phase shifter is utilized to offset the phase error and beam splitter error carried by the fixed MZI. This training process is repeated until the last column of the grid, and the phase values obtained by progressive training can counteract the inaccuracies caused by imperfect photonic devices, thereby improving the recognition accuracy of MZI-ONN. Importantly, this progressive training scheme reduces inaccuracies caused by optical components without altering the topology of MZI-ONN.Results and DiscussionsWe employ the Neuroptica Python simulation platform to construct a cascaded MZI-ONN and validate the efficacy of the proposed training scheme. The error range of the MZI phase shifter is set between 0.05 and 0.10, with a fixed beam splitter error value of 0.10. Results demonstrate that the proposed progressive training scheme based on the Iris dataset enhances the recognition accuracy of a three-layer 4×4 MZI-ONN from 32.50% to 96.65% (Fig. 5). During the application in the MNIST dataset, the accuracy of three-layer ONNs with grid scales of 4×4, 6×6, 8×8, and 16×16 is elevated by 2.00%, 22.33%, 37.00%, and 36.25%, respectively (Fig. 7), significantly improving the error-resistance performance of the ONN. To substantiate the advantages of the proposed method, we compare the proposed progressive training optimization scheme with traditional genetic algorithm (GA) training, the error correction scheme using a redundant rectangular grid (RRM), and a hardware optimization scheme. Notably, compared with the RRM-based error correction scheme and hardware optimization scheme, the proposed scheme exhibits the capability to conserve more MZI units and detectors. Furthermore, while the traditional GA training scheme enhances the recognition accuracy of the Iris dataset with four features and the MNIST dataset with eight features by 23.10% and 32.40%, respectively, the proposed scheme achieves improvements of 64.15% and 37.00% under the same scale (Table 2). In a comprehensive evaluation, this scheme enhances the recognition accuracy of the ONN without augmenting hardware costs and demonstrates superior error-resistance performance.ConclusionsWe introduce a progressive training scheme designed to alleviate recognition errors in MZI-ONN. The scheme improves the recognition accuracy of the ONN without modifying the topology grid structure and parameters, thus causing no additional hardware costs. To validate the effectiveness of this scheme, we conduct simulations by adopting the Neuroptica Python simulation platform as a proof of concept. The error parameters of photon devices are pre-trained, and the MZI-ONN phase is fixed based on the number of iterations. Subsequent phases are then utilized to compensate for errors introduced by the fixed phase. Simulation analyses are performed on ONNs of scales 4×4, 6×6, 8×8, and 16×16, which demonstrates that the proposed progressive scheme can enhance the recognition accuracy of MZI-ONN by up to 64.15% with an average increase of 39.93%, improving the error-resistant performance of MZI-ONN.
Acta Optica Sinica
- Publication Date: Apr. 10, 2024
- Vol. 44, Issue 7, 0720001 (2024)

Zernike and Proper Orthogonal Decomposition of Wavefront Modes of Aero-Optical Effects
Yong Chen, Yudong Li, Qiang Yuan, Xianghong Yao, Junqi Shen, Wei Chang, and Hongxun Li
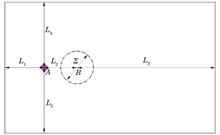
ObjectiveProper orthogonal decomposition (POD) method has been widely applied to time-dependent field analysis, but its direct method and snapshot method both have their inherent problems. The former makes it difficult to solve eigenvalues and eigenvectors of correlation matrices, and the limited sampling number of the latter will affect statistical random field analysis. The direct method needs to solve eigenvalues and eigenvectors of spatial correlation matrices, and the correlation matrix dimensions are the spatial discrete points of the field. When there are more discrete points in the space, the matrix dimensions are high, which results in a large amount of computation, consumed time, occupied memory, and even difficult solutions. The snapshot method is to solve temporal correlation matrices. Generally, by sampling about 200 frames, the correlation matrix dimensions and computation amount are significantly reduced, which makes the POD method practical and operable. However, the few sampling frames will affect the statistical analysis of random field modes, and the calculated modes will vary with the frame number and interval time between frames. Thus, the Zernike and proper orthogonal decomposition (Z-POD) method based on the Zernike polynomial weighted coefficient is established for statistical wavefront mode analysis of aero-optical effects.MethodsThe Z-POD method which introduces the wavefront reconstruction method based on Zernike polynomials is changed from the decomposition of the wavefront itself to that of the weighted coefficients of Zernike polynomials. For the circle domain, given the Zernike polynomial order, weighted coefficients correspond to wavefront distribution one by one, and polynomials of several hundred orders are usually enough to recover various complex wavefront shapes. Since the polynomial order is far less than the discrete point number in the wavefront space, the correlation matrix dimensions are reduced, with reduced computation amount and significantly improved computation calculation efficiency. The Z-POD method does not lose spatial resolution and does not need to limit the maximum samples. Therefore, the temporal statistical characteristics are not affected and predicted wavefront modes have high spatio-temporal resolution.Results and DiscussionsTo verify the effectiveness of the Z-POD method, we employ the large eddy simulation (LES) method to simulate flow around a cylinder and calculate the time series aero-optical effect wavefront generated by the Karman vortex street structure in the cylinder wake for wavefront modal analysis. The spatial resolution of the wavefront is 100×100, the sampled frame number is 20000, and the order of Zernike polynomials is 217. First-order mode and steady-state wavefront distribution are similar (Fig. 7), second-order and third-order modes, and fourth-order and fifth-order modes are approximately paired with each other (Fig. 8). The first ten modes can restore the wavefront shape, the first 49 modes contain more than 97% energy, and the wavefront reconstructed with the complete modes has no essential differences from the original wavefront (Figs. 9 and 10). The modal weighted coefficients and their power spectrum decrease with increasing order. The peak frequencies of the power spectrum of weighted coefficients of the first five modes are consistent with those of fluctuation velocity at the center point of the optical window, corresponding to the main frequency of Karman vortex street, with the Strauhal number of about 0.22 (Figs. 3 and 11).ConclusionsAs it is difficult for us to employ the POD method for statistical analysis of random fields with high spatial resolution and high sampling frames, the Z-POD method is proposed for wavefront modal analysis of time-dependent series aero-optical effects. Based on the original POD method, the Z-POD method introduces wavefront reconstruction based on Zernike polynomials and carries out POD of the weighted coefficients of Zernike polynomials instead of the wavefront itself. Since wavefront reconstruction based on Zernike polynomials has the function of dimensionality reduction for wavefront, the complex wavefront shape can be usually restored with polynomials of several hundred orders, and there is no strict restriction on the number of discrete points and sampling frames of wavefront. Therefore, the correlation matrix dimensions for the Z-POD method are significantly reduced, the computational efficiency is significantly improved, and the wavefront modal analysis can be guaranteed to have a sufficiently high spatio-temporal resolution. In the time series data analysis of wavefront by Karman vortex generated in the wake flow around a cylinder, the Z-POD method also has the advantage of restoring the original wavefront shape with a few modes, and the energy ratios of the first order, 10th order, and 49th order modes are above 44%, 88%, and 97% respectively. Additionally, the wavefront reconstructed with the whole 217 modes is not substantially different from the original wavefront. The Z-POD method has been authorized by a China National invention patent. Since the wavefront reconstruction method based on Zernike polynomials is also applicable to the ring domain and square domain, it is also suitable for statistical analysis of wavefront modes on such domains, and can also be extended to analysis and processing of images, flow fields, and signals on two-dimensional fields. ObjectiveProper orthogonal decomposition (POD) method has been widely applied to time-dependent field analysis, but its direct method and snapshot method both have their inherent problems. The former makes it difficult to solve eigenvalues and eigenvectors of correlation matrices, and the limited sampling number of the latter will affect statistical random field analysis. The direct method needs to solve eigenvalues and eigenvectors of spatial correlation matrices, and the correlation matrix dimensions are the spatial discrete points of the field. When there are more discrete points in the space, the matrix dimensions are high, which results in a large amount of computation, consumed time, occupied memory, and even difficult solutions. The snapshot method is to solve temporal correlation matrices. Generally, by sampling about 200 frames, the correlation matrix dimensions and computation amount are significantly reduced, which makes the POD method practical and operable. However, the few sampling frames will affect the statistical analysis of random field modes, and the calculated modes will vary with the frame number and interval time between frames. Thus, the Zernike and proper orthogonal decomposition (Z-POD) method based on the Zernike polynomial weighted coefficient is established for statistical wavefront mode analysis of aero-optical effects.MethodsThe Z-POD method which introduces the wavefront reconstruction method based on Zernike polynomials is changed from the decomposition of the wavefront itself to that of the weighted coefficients of Zernike polynomials. For the circle domain, given the Zernike polynomial order, weighted coefficients correspond to wavefront distribution one by one, and polynomials of several hundred orders are usually enough to recover various complex wavefront shapes. Since the polynomial order is far less than the discrete point number in the wavefront space, the correlation matrix dimensions are reduced, with reduced computation amount and significantly improved computation calculation efficiency. The Z-POD method does not lose spatial resolution and does not need to limit the maximum samples. Therefore, the temporal statistical characteristics are not affected and predicted wavefront modes have high spatio-temporal resolution.Results and DiscussionsTo verify the effectiveness of the Z-POD method, we employ the large eddy simulation (LES) method to simulate flow around a cylinder and calculate the time series aero-optical effect wavefront generated by the Karman vortex street structure in the cylinder wake for wavefront modal analysis. The spatial resolution of the wavefront is 100×100, the sampled frame number is 20000, and the order of Zernike polynomials is 217. First-order mode and steady-state wavefront distribution are similar (Fig. 7), second-order and third-order modes, and fourth-order and fifth-order modes are approximately paired with each other (Fig. 8). The first ten modes can restore the wavefront shape, the first 49 modes contain more than 97% energy, and the wavefront reconstructed with the complete modes has no essential differences from the original wavefront (Figs. 9 and 10). The modal weighted coefficients and their power spectrum decrease with increasing order. The peak frequencies of the power spectrum of weighted coefficients of the first five modes are consistent with those of fluctuation velocity at the center point of the optical window, corresponding to the main frequency of Karman vortex street, with the Strauhal number of about 0.22 (Figs. 3 and 11).ConclusionsAs it is difficult for us to employ the POD method for statistical analysis of random fields with high spatial resolution and high sampling frames, the Z-POD method is proposed for wavefront modal analysis of time-dependent series aero-optical effects. Based on the original POD method, the Z-POD method introduces wavefront reconstruction based on Zernike polynomials and carries out POD of the weighted coefficients of Zernike polynomials instead of the wavefront itself. Since wavefront reconstruction based on Zernike polynomials has the function of dimensionality reduction for wavefront, the complex wavefront shape can be usually restored with polynomials of several hundred orders, and there is no strict restriction on the number of discrete points and sampling frames of wavefront. Therefore, the correlation matrix dimensions for the Z-POD method are significantly reduced, the computational efficiency is significantly improved, and the wavefront modal analysis can be guaranteed to have a sufficiently high spatio-temporal resolution. In the time series data analysis of wavefront by Karman vortex generated in the wake flow around a cylinder, the Z-POD method also has the advantage of restoring the original wavefront shape with a few modes, and the energy ratios of the first order, 10th order, and 49th order modes are above 44%, 88%, and 97% respectively. Additionally, the wavefront reconstructed with the whole 217 modes is not substantially different from the original wavefront. The Z-POD method has been authorized by a China National invention patent. Since the wavefront reconstruction method based on Zernike polynomials is also applicable to the ring domain and square domain, it is also suitable for statistical analysis of wavefront modes on such domains, and can also be extended to analysis and processing of images, flow fields, and signals on two-dimensional fields.
Acta Optica Sinica
- Publication Date: Dec. 25, 2023
- Vol. 43, Issue 24, 2420001 (2023)
Inverse Reflectance Model Based on Deep Learning
Xi Wang, Zhenxiong Jian, and Mingjun Ren
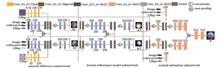
ObjectiveTo enhance the capability of photometric stereo to handle the isotropic non-Lambertian reflectance, an inverse reflectance model based on deep learning is proposed to achieve highly accurate surface normal estimation in this paper. Non-Lambertian reflectance is an important factor affecting the performance of optical measurements like fringe projection. To our best knowledge, photometric stereo is only one technology that could solve the effect of non-Lambertian reflectance in theory. Traditional non-Lambertian photometric stereo methods employ robust estimation, parameterized reflectance model, and general reflectance property to handle the non-Lambertian reflectance, which in essence adopts different mathematical technologies to handle the reflectance model. With the introduction of deep learning technology, it is possible to directly establish the inverse reflectance model, and the capability of photometric stereo to handle the non-Lambertian reflectance significantly increases. The represented supervised deep learning methods are CNN-PS and PS-FCN. The CNN-PS directly maps the observation map recording the intensities under different lightings to the surface normal according to the orientation consistency cue. The performance of this network significantly decreases if there are a small number of lights. PS-FCN simulates the normal estimation process of the pixel-wise inverse reflectance model and employs the neighborhood information to give a robust surface normal estimation for the scene with sparse light. The pixel-wise inverse reflectance model could not globally describe the non-Lambertian reflectance, which is supplemented by introducing collocated light recently. However, there still exist theoretical limitations in the collocated light-based inverse reflectance model. Therefore, this paper attempts to complete the theoretical defect of the collocated light-based inverse reflectance model by effectively extracting the image feature related to azimuth difference and designing the deep-learning-based inverse reflectance model.MethodsWe first analyze the theoretical limitation of the collocated-light-based inverse reflectance model, then design the three-stage subnetworks of the proposed deep learning-based inverse reflectance model, and train the model by the new training strategies. The theoretical defect mainly comes from the assumption of Eq. (4), or in other words, the main direction α should lie on the plane extended by the l and v. Now, the BRDF input value ?φ is simplified by the value lTv. However, lTv is not identical to the ?φ in most circumstances, and ?φ is highly related to the unknown surface normal. The proposed inverse reflectance model based on deep learning is designed as shown in Fig. 1, which consists of three subnetworks, i.e., the azimuth difference subnetwork, the inverse reflectance model subnetwork, and the surface normal estimation subnetwork. The first-stage subnetwork attempts to map the image o under arbitrary lighting, the collocated image o0, and the lighting map l to the ?φ map, and the max-pooling fused feature is introduced to represent the surface normal. The second-stage subnetwork achieves the ideal inverse reflectance model in an image feature way. The output of this subnetwork could be directly utilized to calculate the surface normal by the least-square algorithm, but the shadow thresholding value directly and dramatically influences the estimation accuracy. Thus, the third-stage subnetwork is designed to avoid error accumulation and achieve accurate surface normal estimation. To train the proposed network, the new supplement training dataset is designed to save the low-reflectance data and provide the SVBRDF scene. The three subnetworks are firstly trained separately to obtain the initial model parameters of every subnetwork and then combined to finetune the parameters.Results and DiscussionsIn this paper, the ablation experiment is utilized to prove the effectiveness of the network design, and the synthetic experiment and real experiment are adopted to analyze the performance of the proposed method. The PS-FCN, CNN-PS, and the network proposed by Wang et al., denoted by CH20, IK18, and WJ20, are adopted as comparison methods in this paper. As shown in Table 2, the ablation experiment illustrates that the introduction of the max-pooling fusion feature benefits the extraction of the image features related to the ?φ and the shading, and the azimuth difference subnetwork could effectively supplement the defect of the collocated light-based inverse reflectance model to better handle the isotropic reflectance. The synthetic experiment validates that the proposed method could achieve the best performance on the scene with dense lights, sparse lights, and SVBRDF. Figure 5 exhibits the superior performance of the proposed method on the sparse light scene compared with the WJ20, which shows the necessity of breaking the theoretical limitation of the collocated light-based inverse reflectance model. The real experiment based on the benchmark DiLiGenT dataset proves the state-of-the-art performance of the proposed method. Table 6 and Table 7 demonstrate that our method could achieve an average surface normal estimation accuracy of 5.90° for the real scene, and the performance of the proposed method significantly increases under the sparse light scene.ConclusionsWe design the inverse reflectance model based on deep learning to handle the isotropic non-Lambertian reflectance, which completes the theoretical defect of the collocated light-based inverse reflectance model by effectively extracting the image feature related to the azimuth difference. The proposed model contains three subnetworks: the azimuth difference subnetwork, the inverse reflectance model subnetwork, and the surface normal estimation subnetwork. The first two subnetworks achieve the inverse mapping between the intensity and the dot product of surface normal and lighting direction, and the third network fully employs the image features extracted by these two subnetworks to accurately estimate the surface normal. The proposed method contains three characteristics, i.e., the introduction of max-pooling fusion feature to extract the feature related to ?φ, inverse reflectance model based on the image feature, and stage training strategy. The ablation experiment proves the rationality of the network design, and the synthetic experiments validate that the proposed method could simultaneously handle classical 100 isotropic reflectances. The real experiments based on benchmark DiLiGenT dataset illustrate that the proposed method could achieve accurate surface normal estimation with 5.90°. The synthetic and real experiments validate the state-of-the-art performance of the proposed method. In future work, we would like to inversely model the challenging anisotropic reflectance and to break the limitation of parallel lighting and orthogonal cameras for photometric stereo. ObjectiveTo enhance the capability of photometric stereo to handle the isotropic non-Lambertian reflectance, an inverse reflectance model based on deep learning is proposed to achieve highly accurate surface normal estimation in this paper. Non-Lambertian reflectance is an important factor affecting the performance of optical measurements like fringe projection. To our best knowledge, photometric stereo is only one technology that could solve the effect of non-Lambertian reflectance in theory. Traditional non-Lambertian photometric stereo methods employ robust estimation, parameterized reflectance model, and general reflectance property to handle the non-Lambertian reflectance, which in essence adopts different mathematical technologies to handle the reflectance model. With the introduction of deep learning technology, it is possible to directly establish the inverse reflectance model, and the capability of photometric stereo to handle the non-Lambertian reflectance significantly increases. The represented supervised deep learning methods are CNN-PS and PS-FCN. The CNN-PS directly maps the observation map recording the intensities under different lightings to the surface normal according to the orientation consistency cue. The performance of this network significantly decreases if there are a small number of lights. PS-FCN simulates the normal estimation process of the pixel-wise inverse reflectance model and employs the neighborhood information to give a robust surface normal estimation for the scene with sparse light. The pixel-wise inverse reflectance model could not globally describe the non-Lambertian reflectance, which is supplemented by introducing collocated light recently. However, there still exist theoretical limitations in the collocated light-based inverse reflectance model. Therefore, this paper attempts to complete the theoretical defect of the collocated light-based inverse reflectance model by effectively extracting the image feature related to azimuth difference and designing the deep-learning-based inverse reflectance model.MethodsWe first analyze the theoretical limitation of the collocated-light-based inverse reflectance model, then design the three-stage subnetworks of the proposed deep learning-based inverse reflectance model, and train the model by the new training strategies. The theoretical defect mainly comes from the assumption of Eq. (4), or in other words, the main direction α should lie on the plane extended by the l and v. Now, the BRDF input value ?φ is simplified by the value lTv. However, lTv is not identical to the ?φ in most circumstances, and ?φ is highly related to the unknown surface normal. The proposed inverse reflectance model based on deep learning is designed as shown in Fig. 1, which consists of three subnetworks, i.e., the azimuth difference subnetwork, the inverse reflectance model subnetwork, and the surface normal estimation subnetwork. The first-stage subnetwork attempts to map the image o under arbitrary lighting, the collocated image o0, and the lighting map l to the ?φ map, and the max-pooling fused feature is introduced to represent the surface normal. The second-stage subnetwork achieves the ideal inverse reflectance model in an image feature way. The output of this subnetwork could be directly utilized to calculate the surface normal by the least-square algorithm, but the shadow thresholding value directly and dramatically influences the estimation accuracy. Thus, the third-stage subnetwork is designed to avoid error accumulation and achieve accurate surface normal estimation. To train the proposed network, the new supplement training dataset is designed to save the low-reflectance data and provide the SVBRDF scene. The three subnetworks are firstly trained separately to obtain the initial model parameters of every subnetwork and then combined to finetune the parameters.Results and DiscussionsIn this paper, the ablation experiment is utilized to prove the effectiveness of the network design, and the synthetic experiment and real experiment are adopted to analyze the performance of the proposed method. The PS-FCN, CNN-PS, and the network proposed by Wang et al., denoted by CH20, IK18, and WJ20, are adopted as comparison methods in this paper. As shown in Table 2, the ablation experiment illustrates that the introduction of the max-pooling fusion feature benefits the extraction of the image features related to the ?φ and the shading, and the azimuth difference subnetwork could effectively supplement the defect of the collocated light-based inverse reflectance model to better handle the isotropic reflectance. The synthetic experiment validates that the proposed method could achieve the best performance on the scene with dense lights, sparse lights, and SVBRDF. Figure 5 exhibits the superior performance of the proposed method on the sparse light scene compared with the WJ20, which shows the necessity of breaking the theoretical limitation of the collocated light-based inverse reflectance model. The real experiment based on the benchmark DiLiGenT dataset proves the state-of-the-art performance of the proposed method. Table 6 and Table 7 demonstrate that our method could achieve an average surface normal estimation accuracy of 5.90° for the real scene, and the performance of the proposed method significantly increases under the sparse light scene.ConclusionsWe design the inverse reflectance model based on deep learning to handle the isotropic non-Lambertian reflectance, which completes the theoretical defect of the collocated light-based inverse reflectance model by effectively extracting the image feature related to the azimuth difference. The proposed model contains three subnetworks: the azimuth difference subnetwork, the inverse reflectance model subnetwork, and the surface normal estimation subnetwork. The first two subnetworks achieve the inverse mapping between the intensity and the dot product of surface normal and lighting direction, and the third network fully employs the image features extracted by these two subnetworks to accurately estimate the surface normal. The proposed method contains three characteristics, i.e., the introduction of max-pooling fusion feature to extract the feature related to ?φ, inverse reflectance model based on the image feature, and stage training strategy. The ablation experiment proves the rationality of the network design, and the synthetic experiments validate that the proposed method could simultaneously handle classical 100 isotropic reflectances. The real experiments based on benchmark DiLiGenT dataset illustrate that the proposed method could achieve accurate surface normal estimation with 5.90°. The synthetic and real experiments validate the state-of-the-art performance of the proposed method. In future work, we would like to inversely model the challenging anisotropic reflectance and to break the limitation of parallel lighting and orthogonal cameras for photometric stereo.
Acta Optica Sinica
- Publication Date: Nov. 10, 2023
- Vol. 43, Issue 21, 2120001 (2023)
Development of Precise 3D Mask Model with Reduced Runtime for Lithography
Han Bao, and Yong Zhang
ObjectiveScattering caused by the thickness of the absorber layer of the mask leads to deviations in deep ultraviolet (DUV) and extreme ultraviolet (EUV) lithography. Traditional lithography models are based on Hopkins' method and the thin mask approximation, wherein diffracted waves from the mask satisfy the Fourier transform of the mask patterns. As the aspect ratio of the absorbing layer on the mask increases, the mask thickness becomes a non-negligible factor in diffraction calculation. Thick absorbers change the diffracted waves, particularly along the edges of the pattern. To accurately predict the aerial image, a 3D mask model is proposed to correct the Hopkin's model using the mask near fields generated via rigorous electromagnetic simulation, such as the finite-difference time-domain (FDTD) method. The computational cost of rigorous electromagnetic simulations can be reduced using a fast mask near-field generation method based on rotation transformation and dimension reduction. By combining a 3D mask model with a fast near-field generation method, an accurate 3D mask lithographic model can be rapidly constructed. The 3D mask model offers the advantages of less runtime and high accuracy when dealing with cases involving complex source and any-angle mask patterns.MethodsFirst, a rotation transformation was applied to any given case. The source was decomposed by polarization, and each component of the source was rotated with the incident edge in such a way that the incident angle of the light remained unchanged on the vertical or horizontal incident edge. Next, a 2D FDTD simulation was implemented by reducing the dimension of the simulation area along the incident edge. This 2D FDTD simulation generates a 1D accurate electromagnetic wave distribution near the mask absorbers, with the 1D accurate wave distribution describing the diffracted wave on the line perpendicular to the incident edge. Subsequently, the FDTD-generated 1D wave distribution was expanded along the incident edge and used to modify the thin mask approximated results to obtain a correct mask transmission function. Finally, the modified mask transmission function calculated the aerial images involving mask 3D effects.Results and DiscussionsRigorous electromagnetic simulations are conducted via FDTD, wherein electromagnetic wave propagation is modeled by solving Maxwell's equations on Yee's grid. A 3D FDTD simulation is conducted with oblique incidence on a square with a 30-degree rotation angle (Fig.3). The mask absorber is set as MoSi with a 70 nm thickness and a refractive index of 2.2. The near fields after mask diffraction are calculated, with an emphasis on the fields on the marked line perpendicular to the edges. Subsequently, 3D FDTD simulations with a rotated source on Manhattan polygons are performed (Fig.4, 5). The incident angle of the wave on the observed edge is kept equal to that of the original case. Furthermore, near fields of y and z polarization components are calculated and weighted superposition is derived (Fig.6). Next, a series of 2D FDTD simulations with a rotated source and dimension reduction is conducted. Near fields along the line perpendicular to the observed edge are calculated, and superposition is applied. Finally, the 1D edge near fields extracted from 2D near fields generated via 3D FDTD is compared with the results generated directly via 2D FDTD (Fig.7). The agreement of the edge near fields demonstrates the applicability of the rotation and dimension reduction method. Furthermore, the 2D simulation shows advantages in runtime, taking 2 min, while the 3D simulation takes approximately 40 min.ConclusionsA novel mask 3D imaging model for lithography is developed in this study. The principles of the Hopkin's model are analyzed to reveal that the mask transmission function can no longer be derived directly from the Fourier transform by considering scattering caused by the thickness of the absorber layers. The FDTD method is applied to calculate the near fields of absorbers to implement rigorous electromagnetic simulation. Experimental results show that the near fields on the line perpendicular to the observed edge can be calculated quickly with high accuracy by applying rotation transformation and dimension reduction. Any incident angle on an any-angle edge can be converted to a Manhattan case, and near fields can be computed rapidly using 2D FDTD simulation. These near fields are then used to derive a correct mask transmission function, and the modified Hopkin's approach calculates aerial images on the wafer. The method used in this paper has a shorter runtime when handling complex or even freeform illumination sources and masks with any-angle polygons. Furthermore, because near fields can be generated in advance and the corrected mask transmission function can be reused in the entire layout, this method becomes more practical in 3D mask image models for full-chip prediction. This helps foundries save time in the production flow. ObjectiveScattering caused by the thickness of the absorber layer of the mask leads to deviations in deep ultraviolet (DUV) and extreme ultraviolet (EUV) lithography. Traditional lithography models are based on Hopkins' method and the thin mask approximation, wherein diffracted waves from the mask satisfy the Fourier transform of the mask patterns. As the aspect ratio of the absorbing layer on the mask increases, the mask thickness becomes a non-negligible factor in diffraction calculation. Thick absorbers change the diffracted waves, particularly along the edges of the pattern. To accurately predict the aerial image, a 3D mask model is proposed to correct the Hopkin's model using the mask near fields generated via rigorous electromagnetic simulation, such as the finite-difference time-domain (FDTD) method. The computational cost of rigorous electromagnetic simulations can be reduced using a fast mask near-field generation method based on rotation transformation and dimension reduction. By combining a 3D mask model with a fast near-field generation method, an accurate 3D mask lithographic model can be rapidly constructed. The 3D mask model offers the advantages of less runtime and high accuracy when dealing with cases involving complex source and any-angle mask patterns.MethodsFirst, a rotation transformation was applied to any given case. The source was decomposed by polarization, and each component of the source was rotated with the incident edge in such a way that the incident angle of the light remained unchanged on the vertical or horizontal incident edge. Next, a 2D FDTD simulation was implemented by reducing the dimension of the simulation area along the incident edge. This 2D FDTD simulation generates a 1D accurate electromagnetic wave distribution near the mask absorbers, with the 1D accurate wave distribution describing the diffracted wave on the line perpendicular to the incident edge. Subsequently, the FDTD-generated 1D wave distribution was expanded along the incident edge and used to modify the thin mask approximated results to obtain a correct mask transmission function. Finally, the modified mask transmission function calculated the aerial images involving mask 3D effects.Results and DiscussionsRigorous electromagnetic simulations are conducted via FDTD, wherein electromagnetic wave propagation is modeled by solving Maxwell's equations on Yee's grid. A 3D FDTD simulation is conducted with oblique incidence on a square with a 30-degree rotation angle (Fig.3). The mask absorber is set as MoSi with a 70 nm thickness and a refractive index of 2.2. The near fields after mask diffraction are calculated, with an emphasis on the fields on the marked line perpendicular to the edges. Subsequently, 3D FDTD simulations with a rotated source on Manhattan polygons are performed (Fig.4, 5). The incident angle of the wave on the observed edge is kept equal to that of the original case. Furthermore, near fields of y and z polarization components are calculated and weighted superposition is derived (Fig.6). Next, a series of 2D FDTD simulations with a rotated source and dimension reduction is conducted. Near fields along the line perpendicular to the observed edge are calculated, and superposition is applied. Finally, the 1D edge near fields extracted from 2D near fields generated via 3D FDTD is compared with the results generated directly via 2D FDTD (Fig.7). The agreement of the edge near fields demonstrates the applicability of the rotation and dimension reduction method. Furthermore, the 2D simulation shows advantages in runtime, taking 2 min, while the 3D simulation takes approximately 40 min.ConclusionsA novel mask 3D imaging model for lithography is developed in this study. The principles of the Hopkin's model are analyzed to reveal that the mask transmission function can no longer be derived directly from the Fourier transform by considering scattering caused by the thickness of the absorber layers. The FDTD method is applied to calculate the near fields of absorbers to implement rigorous electromagnetic simulation. Experimental results show that the near fields on the line perpendicular to the observed edge can be calculated quickly with high accuracy by applying rotation transformation and dimension reduction. Any incident angle on an any-angle edge can be converted to a Manhattan case, and near fields can be computed rapidly using 2D FDTD simulation. These near fields are then used to derive a correct mask transmission function, and the modified Hopkin's approach calculates aerial images on the wafer. The method used in this paper has a shorter runtime when handling complex or even freeform illumination sources and masks with any-angle polygons. Furthermore, because near fields can be generated in advance and the corrected mask transmission function can be reused in the entire layout, this method becomes more practical in 3D mask image models for full-chip prediction. This helps foundries save time in the production flow.
Acta Optica Sinica
- Publication Date: Jul. 10, 2023
- Vol. 43, Issue 13, 1320004 (2023)
Wavefront Aberration Fitting for Economic Tolerance Application
Hao Jiang, Yuan Hu, Jiaqi Huo, Zhiliang Zhao, and Yuegang Fu
ObjectiveEconomic tolerance is characterized by meeting the image quality requirements and minimizing processing costs, and it thus achieves looser tolerances. In nature, it is the balance of the relationship between image quality and processing costs. At present, in the research related to the establishment of the relationship function between image quality and tolerance, the theory is macro, and modulation transfer function (MTF) is mostly used as the image quality evaluation standard for detailed study, which makes the image quality single. In the analysis based on ray tracing theory, only three structural parameters, namely the radius of curvature, thickness, and refractive index are included, with fewer types. In addition, in the current method, the differential ray tracing method cannot ensure the accuracy of the image quality function in some instances. In contrast, the Youngworth method results in excessive image quality traces. Therefore, we wish to enrich the image quality evaluation methods and improve the types of structural parameters. Meanwhile, we propose methods that have high precision and can reduce the number of image quality traces.MethodsThe functional relationship between the tolerance and the image quality is usually expressed by the form of the second-order Taylor formula. In the equation, the first-order derivative and the second-order derivative are called the first-order sensitivity coefficient and the second-order sensitivity coefficient, which can be collectively referred to as the sensitivity coefficient. The sensitivity coefficient effectively measures the sensitivity of the image quality to the structural parameters. The first-order sensitivity coefficient determines the trend of the image quality. Due to the analysis of the effect of two different structural parameters on the image quality, the second-order sensitivity coefficient ensures the accuracy of the image quality function. In this paper, wavefront aberration is used as the image quality evaluation criterion. The first-order sensitivity coefficients of eccentricity and decenter structural parameters with respect to wavefront aberration are deduced and improved based on ray tracing theory, which solves the shortcoming of a few types of structural parameters. In order to address the problem of excessive image quality traces, two methods of sequential derivation and formula transfer term are proposed to establish the mathematical model of the second-order sensitivity coefficient, so as to realize high-precision, simple, and fast establishment of function.Results and DiscussionsFirstly, a doublet optical system is optimized and designed for theoretical verification (Fig. 3, Table 1). Secondly, in order to verify the accuracy of the fitting of the function between the tolerance and the image quality established by using the theory of this paper, the fitting analysis is performed for single-parameter tolerance and two-parameter tolerance and compared with the existing Youngworth method (Figs. 4-7). The verification results reveal that both the formula transfer term method and the Youngworth method have basically identical fitting accuracy for single and two parameters. The residual sum of squares is in the range of 10-6-10-7, but the number of traces of the formula transfer method is far less than that of the Youngworth method, which requires a smaller amount of data. However, the sequential derivation method can only be used to analyze the optical back focal length and verifies that it is linearly with the wavefront aberration. Eventually, the economic analysis of the doublet lens is carried out according to the economic tolerance theory. The set of economic tolerances for wavefront aberration of -0.5λ is listed (Table 5), as well as a graph demonstrating the relationship between wavefront aberration and cost (Fig. 8).ConclusionsThe application of the tolerance and image quality relationship function proposed in this paper to establish the model can enrich and improve the variety of structural parameters, effectively reduce the number of image quality traces, and ensure the high accuracy of the fitting. The research results show that the first-order sensitivity coefficients can be solved by the formula transfer term method that can avoid the integration operation with the ray tracing theory. Although image quality tracing is applied to calculate the second-order sensitivity coefficient, the number of traces is significantly reduced compared with the Youngworth method, which relieves the pressure of data storage and maintains the high fitting accuracy of the function. This method can be used to efficiently assign economic tolerances of optical systems. The sequential derivation method requires no additional tracing image quality. However, this method involves complex solutions, difficult practice, and limited application. Currently, only the back focal length that is linear with the wavefront aberration can be effectively analyzed. In addition, the proposed tolerance wavefront aberration fitting methods have significance for other image quality evaluation methods and can promote the application of economic tolerance for optical systems. ObjectiveEconomic tolerance is characterized by meeting the image quality requirements and minimizing processing costs, and it thus achieves looser tolerances. In nature, it is the balance of the relationship between image quality and processing costs. At present, in the research related to the establishment of the relationship function between image quality and tolerance, the theory is macro, and modulation transfer function (MTF) is mostly used as the image quality evaluation standard for detailed study, which makes the image quality single. In the analysis based on ray tracing theory, only three structural parameters, namely the radius of curvature, thickness, and refractive index are included, with fewer types. In addition, in the current method, the differential ray tracing method cannot ensure the accuracy of the image quality function in some instances. In contrast, the Youngworth method results in excessive image quality traces. Therefore, we wish to enrich the image quality evaluation methods and improve the types of structural parameters. Meanwhile, we propose methods that have high precision and can reduce the number of image quality traces.MethodsThe functional relationship between the tolerance and the image quality is usually expressed by the form of the second-order Taylor formula. In the equation, the first-order derivative and the second-order derivative are called the first-order sensitivity coefficient and the second-order sensitivity coefficient, which can be collectively referred to as the sensitivity coefficient. The sensitivity coefficient effectively measures the sensitivity of the image quality to the structural parameters. The first-order sensitivity coefficient determines the trend of the image quality. Due to the analysis of the effect of two different structural parameters on the image quality, the second-order sensitivity coefficient ensures the accuracy of the image quality function. In this paper, wavefront aberration is used as the image quality evaluation criterion. The first-order sensitivity coefficients of eccentricity and decenter structural parameters with respect to wavefront aberration are deduced and improved based on ray tracing theory, which solves the shortcoming of a few types of structural parameters. In order to address the problem of excessive image quality traces, two methods of sequential derivation and formula transfer term are proposed to establish the mathematical model of the second-order sensitivity coefficient, so as to realize high-precision, simple, and fast establishment of function.Results and DiscussionsFirstly, a doublet optical system is optimized and designed for theoretical verification (Fig. 3, Table 1). Secondly, in order to verify the accuracy of the fitting of the function between the tolerance and the image quality established by using the theory of this paper, the fitting analysis is performed for single-parameter tolerance and two-parameter tolerance and compared with the existing Youngworth method (Figs. 4-7). The verification results reveal that both the formula transfer term method and the Youngworth method have basically identical fitting accuracy for single and two parameters. The residual sum of squares is in the range of 10-6-10-7, but the number of traces of the formula transfer method is far less than that of the Youngworth method, which requires a smaller amount of data. However, the sequential derivation method can only be used to analyze the optical back focal length and verifies that it is linearly with the wavefront aberration. Eventually, the economic analysis of the doublet lens is carried out according to the economic tolerance theory. The set of economic tolerances for wavefront aberration of -0.5λ is listed (Table 5), as well as a graph demonstrating the relationship between wavefront aberration and cost (Fig. 8).ConclusionsThe application of the tolerance and image quality relationship function proposed in this paper to establish the model can enrich and improve the variety of structural parameters, effectively reduce the number of image quality traces, and ensure the high accuracy of the fitting. The research results show that the first-order sensitivity coefficients can be solved by the formula transfer term method that can avoid the integration operation with the ray tracing theory. Although image quality tracing is applied to calculate the second-order sensitivity coefficient, the number of traces is significantly reduced compared with the Youngworth method, which relieves the pressure of data storage and maintains the high fitting accuracy of the function. This method can be used to efficiently assign economic tolerances of optical systems. The sequential derivation method requires no additional tracing image quality. However, this method involves complex solutions, difficult practice, and limited application. Currently, only the back focal length that is linear with the wavefront aberration can be effectively analyzed. In addition, the proposed tolerance wavefront aberration fitting methods have significance for other image quality evaluation methods and can promote the application of economic tolerance for optical systems.
Acta Optica Sinica
- Publication Date: Jul. 10, 2023
- Vol. 43, Issue 13, 1320003 (2023)

Conformal Orthogonal Basis for Topology Optimization of Mirror Support Structures
Yufeng Tang, Yincheng Shi, Wenli Li, Yisheng Chen, Chong Wang, and Zhenyu Liu
ObjectiveIn the optimization design of optomechanical systems, polynomials can not only retain a significant amount of information but also provide a more compact representation of structural deformation and facilitate integration between mechanical structures and optical models. Zernike polynomials have been widely employed due to their orthogonality properties on a unit circle. However, the orthogonality of Zernike polynomials only applies to continuous data on a circular aperture, and it degrades for discrete interpolation and non-circular apertures. Non-orthogonality means that coupling exists among different terms of polynomials, and the number of polynomials cannot be arbitrarily increased or decreased, which can lead to accuracy and stability problems in surface approximation and optimization design. This study aims to propose a conformal orthogonal basis generated by the eigenmodes of the Laplace equation for utilization in the topology optimization of support structures for reflective mirrors, thus avoiding Zernike orthogonality loss. Additionally, due to the conformal properties of the Laplace eigenmodes in the domain, the obtained basis represents the deformed information along the surface normal. As the principal direction of deformation, the surface normal makes the eigenmodes a better fit for surface deformations.MethodsThe Laplace characteristic equation and Zernike polynomials both originate from the Sturm-Liouville problem. The solutions on the planar circular domain exhibit similarities with Zernike polynomials, and Trevino et.al.[10] have compared the characteristic modal functions (Bessel circle polynomials) and Zernike polynomials in eye surface fitting, which indicates that the former provides better fitting. This paper extends the planar domain to surfaces. The finite element solution of the Laplace equation and properties of the eigenvalue problem ensure the discrete orthogonality of the characteristic modal functions. The mathematical properties of this equation guarantee the completeness of analytical solutions of the characteristic modal functions, and the completeness is verified by combining function approximation theory and numerical experiments. In addition, a specific topology optimization example demonstrates that the characteristic modal functions not only yield similar results to Zernike polynomials on circular domains but also can be applied to non-circular apertures where Zernike polynomials are not suitable.Results and DiscussionsFirst, based on the Sturm-Liouville decomposition on compact Riemannian manifolds, the completeness of the eigenmodes under analytic conditions is demonstrated. Then, the feasibility of adopting eigenmodes to fit surface deformations is numerically validated by adopting function approximation theory as the basis (Figs. 4 and 5). Additionally, this paper applies the method of surface approximation using eigenmodes to topology optimization of circular mirror support structures and compares it with Zernike polynomial approximation. The comparative results indicate that the objective functions optimized through characteristic modal functions and Zernike polynomials are 4.40% and 4.43% of the original structure respectively. The root mean square (RMS) values are 4.40% and 2.55% of the original structure respectively, and the peak to valley (PV) values are 10.51% and 8.73% of the original structure respectively. Both methods prove comparable optimization effectiveness (Table 1). The curves of the objective and constraint values during the iteration show that both methods have consistent stability and can converge (Figs. 11 and 12). However, there are slight differences in the resulting structures (Figs. 9 and 10). After comparative experiments, this study applies the modal fitting method to a hexagonal mirror, thereby completing the topology optimization design of a hexagonal mirror support structure (Fig. 14) and extending its applicability to non-circular apertures.ConclusionsThis paper proposes to adopt a conformal orthogonal basis, which is the Laplace eigenmodes, for approximating surface deformations, and applies it to topology optimization of optical structures. It also demonstrates analytically and numerically that the Laplace eigenmodes are not only completed on circular domains but also on other irregular shapes. Surface eigenmodes can be employed to approximate smooth mirror surface deformations and achieve topology optimization of optical single mirror support structures with specific modal coefficients being the optimization objectives. Two optimization examples show the applicability of the proposed basis on circular domains and its extensibility on non-circular domains. However, compared to Zernike polynomials, the Laplace eigenmodes studied in this paper only exist in piecewise discrete numerical solutions, which means that the eigenmodes do not have an analytical representation like Zernike polynomials. When solving for the normal of a deformed mirror surface, it is necessary to pay attention to the continuity of the normal vector at the element boundary, which is a field that deserves further exploration in future work. ObjectiveIn the optimization design of optomechanical systems, polynomials can not only retain a significant amount of information but also provide a more compact representation of structural deformation and facilitate integration between mechanical structures and optical models. Zernike polynomials have been widely employed due to their orthogonality properties on a unit circle. However, the orthogonality of Zernike polynomials only applies to continuous data on a circular aperture, and it degrades for discrete interpolation and non-circular apertures. Non-orthogonality means that coupling exists among different terms of polynomials, and the number of polynomials cannot be arbitrarily increased or decreased, which can lead to accuracy and stability problems in surface approximation and optimization design. This study aims to propose a conformal orthogonal basis generated by the eigenmodes of the Laplace equation for utilization in the topology optimization of support structures for reflective mirrors, thus avoiding Zernike orthogonality loss. Additionally, due to the conformal properties of the Laplace eigenmodes in the domain, the obtained basis represents the deformed information along the surface normal. As the principal direction of deformation, the surface normal makes the eigenmodes a better fit for surface deformations.MethodsThe Laplace characteristic equation and Zernike polynomials both originate from the Sturm-Liouville problem. The solutions on the planar circular domain exhibit similarities with Zernike polynomials, and Trevino et.al.[10] have compared the characteristic modal functions (Bessel circle polynomials) and Zernike polynomials in eye surface fitting, which indicates that the former provides better fitting. This paper extends the planar domain to surfaces. The finite element solution of the Laplace equation and properties of the eigenvalue problem ensure the discrete orthogonality of the characteristic modal functions. The mathematical properties of this equation guarantee the completeness of analytical solutions of the characteristic modal functions, and the completeness is verified by combining function approximation theory and numerical experiments. In addition, a specific topology optimization example demonstrates that the characteristic modal functions not only yield similar results to Zernike polynomials on circular domains but also can be applied to non-circular apertures where Zernike polynomials are not suitable.Results and DiscussionsFirst, based on the Sturm-Liouville decomposition on compact Riemannian manifolds, the completeness of the eigenmodes under analytic conditions is demonstrated. Then, the feasibility of adopting eigenmodes to fit surface deformations is numerically validated by adopting function approximation theory as the basis (Figs. 4 and 5). Additionally, this paper applies the method of surface approximation using eigenmodes to topology optimization of circular mirror support structures and compares it with Zernike polynomial approximation. The comparative results indicate that the objective functions optimized through characteristic modal functions and Zernike polynomials are 4.40% and 4.43% of the original structure respectively. The root mean square (RMS) values are 4.40% and 2.55% of the original structure respectively, and the peak to valley (PV) values are 10.51% and 8.73% of the original structure respectively. Both methods prove comparable optimization effectiveness (Table 1). The curves of the objective and constraint values during the iteration show that both methods have consistent stability and can converge (Figs. 11 and 12). However, there are slight differences in the resulting structures (Figs. 9 and 10). After comparative experiments, this study applies the modal fitting method to a hexagonal mirror, thereby completing the topology optimization design of a hexagonal mirror support structure (Fig. 14) and extending its applicability to non-circular apertures.ConclusionsThis paper proposes to adopt a conformal orthogonal basis, which is the Laplace eigenmodes, for approximating surface deformations, and applies it to topology optimization of optical structures. It also demonstrates analytically and numerically that the Laplace eigenmodes are not only completed on circular domains but also on other irregular shapes. Surface eigenmodes can be employed to approximate smooth mirror surface deformations and achieve topology optimization of optical single mirror support structures with specific modal coefficients being the optimization objectives. Two optimization examples show the applicability of the proposed basis on circular domains and its extensibility on non-circular domains. However, compared to Zernike polynomials, the Laplace eigenmodes studied in this paper only exist in piecewise discrete numerical solutions, which means that the eigenmodes do not have an analytical representation like Zernike polynomials. When solving for the normal of a deformed mirror surface, it is necessary to pay attention to the continuity of the normal vector at the element boundary, which is a field that deserves further exploration in future work.
Acta Optica Sinica
- Publication Date: Jul. 10, 2023
- Vol. 43, Issue 13, 1320002 (2023)
Time-Domain P3 Equation for Light Transmission in Two-Layer Slab Medium
Xichang Wang
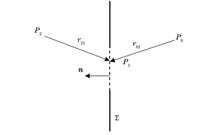
ObjectiveIt is of great significance to study the optical properties of biological tissue and simulate the distribution of light in tissue for light therapy and diagnosis. Therefore, a theoretical model of optical properties needs to be determined. Currently, the model commonly used in biological tissue is the radiative transfer equation. The most widely used one is the first-order approximation of the radiative transfer model, namely the diffusion equation. However, in the case of small detection distance and large absorption, the diffusion equation is not accurate. Therefore, some people have studied the third-order approximation P3 equation of the radiative transfer model. Compared with the diffusion equation, the P3 equation is more accurate and more widely applied, but it is more complicated to establish a mathematical model. At present, several P3 equation models are studied in one layer medium. In fact, biological tissue is a multilayer medium, so it is necessary to establish the P3 model of multilayer tissue. At present, there are several models in the diffusion equation that can solve the problem in a multilayer medium. In particular, Kienle et al. obtained the exact solutions of the diffusion equation in the steady state and frequency and time domains of light transmission in two semi-infinite thick media through the inverse Fourier transform. It is necessary to establish the P3 equation of light transmission in two or more layers. In this paper, the P3 time domain equation of light transmission in a two-layer slab medium is given and compared with Monte Carlo simulation and diffusion equation.MethodsOn the basis of the radiative transfer theory, the P3 equation is given. According to Fourier transform method, the frequency domain solution is established. Based on the Fourier transform in the frequency domain, the time domain solution of the P3 equation in a two-layer slab medium is given. Monte Carlo simulation is a statistical verification method, which can replace experiments to verify the correctness of the theoretical model. The P3 time domain equation and diffusion equation are calculated, and the Monte Carlo simulation program for the multi-layer medium is written. The P3 time domain equation of light transmission in a two-layer slab medium is verified by Monte Carlo simulation. The advantages of the P3 time domain equation and the diffusion equation in the case of low absorption coefficient at a long distance and high absorption coefficient at a short distance are compared.Results and DiscussionsThe P3 time domain equation of the two-layer slab medium is compared with the Monte Carlo simulation. The results show that the reflectance and transmittance of the P3 time domain equation for light transmission in the two-layer slab medium are in good agreement with the Monte Carlo simulation results, which indicates that the P3 time domain equation for light transmission in the two-layer slab medium correctly reflects the light migration in the medium. The P3 time domain equation is compared with the time domain diffusion equation of a multi-layer medium. When the absorption coefficient is low, and the detection distance is large, the results of the P3 equation are consistent with those of the diffusion equation. Near the peak value, the reflectance error of the P3 equation is about 3%, and that of the diffusion equation is about 7%. The transmittance error of the P3 equation is about 7%, and that of the diffusion equation is about 13%. In other words, when the diffusion equation is satisfied, the P3 equation is more accurate than the diffusion equation at the peak value. When the absorption coefficient is high, and the detection distance is small, the reflectance error of the diffusion equation is about 30%. The transmittance error of the P3 equation is about 10%, and that of the diffusion equation is about 20%. It is further indicated that the reflectance and transmittance of the P3 equation are more accurate than those of the diffusion equation when the absorption coefficient is larger near the source. So the P3 time domain equation in a two-layer medium has an advantage over the diffusion equation.ConclusionsThe P3 time domain equation of light transmission in a two-layer slab medium is given. The P3 time domain equation is consistent with the Monte Carlo simulation results and is more accurate than the diffusion equation. So the diffusion equation of the two-layer medium can be replaced by the P3 time domain equation. When the optical parameters of the two layers are the same, a one-layer model can be derived. Therefore, the P3 equation in a two-layer slab medium not only includes the P3 equation in a one-layer slab medium but also lays the foundation for the P3 equation in a multi-layer slab medium. At present, the diffusion equation is used to extract the optical parameters of biological tissue, and the P3 equation in the one-layer medium is used to extract the optical parameters of biological tissue. Therefore, the P3 time domain diffusion equation in a two-layer medium can be used to extract the optical parameters of multi-layer media. ObjectiveIt is of great significance to study the optical properties of biological tissue and simulate the distribution of light in tissue for light therapy and diagnosis. Therefore, a theoretical model of optical properties needs to be determined. Currently, the model commonly used in biological tissue is the radiative transfer equation. The most widely used one is the first-order approximation of the radiative transfer model, namely the diffusion equation. However, in the case of small detection distance and large absorption, the diffusion equation is not accurate. Therefore, some people have studied the third-order approximation P3 equation of the radiative transfer model. Compared with the diffusion equation, the P3 equation is more accurate and more widely applied, but it is more complicated to establish a mathematical model. At present, several P3 equation models are studied in one layer medium. In fact, biological tissue is a multilayer medium, so it is necessary to establish the P3 model of multilayer tissue. At present, there are several models in the diffusion equation that can solve the problem in a multilayer medium. In particular, Kienle et al. obtained the exact solutions of the diffusion equation in the steady state and frequency and time domains of light transmission in two semi-infinite thick media through the inverse Fourier transform. It is necessary to establish the P3 equation of light transmission in two or more layers. In this paper, the P3 time domain equation of light transmission in a two-layer slab medium is given and compared with Monte Carlo simulation and diffusion equation.MethodsOn the basis of the radiative transfer theory, the P3 equation is given. According to Fourier transform method, the frequency domain solution is established. Based on the Fourier transform in the frequency domain, the time domain solution of the P3 equation in a two-layer slab medium is given. Monte Carlo simulation is a statistical verification method, which can replace experiments to verify the correctness of the theoretical model. The P3 time domain equation and diffusion equation are calculated, and the Monte Carlo simulation program for the multi-layer medium is written. The P3 time domain equation of light transmission in a two-layer slab medium is verified by Monte Carlo simulation. The advantages of the P3 time domain equation and the diffusion equation in the case of low absorption coefficient at a long distance and high absorption coefficient at a short distance are compared.Results and DiscussionsThe P3 time domain equation of the two-layer slab medium is compared with the Monte Carlo simulation. The results show that the reflectance and transmittance of the P3 time domain equation for light transmission in the two-layer slab medium are in good agreement with the Monte Carlo simulation results, which indicates that the P3 time domain equation for light transmission in the two-layer slab medium correctly reflects the light migration in the medium. The P3 time domain equation is compared with the time domain diffusion equation of a multi-layer medium. When the absorption coefficient is low, and the detection distance is large, the results of the P3 equation are consistent with those of the diffusion equation. Near the peak value, the reflectance error of the P3 equation is about 3%, and that of the diffusion equation is about 7%. The transmittance error of the P3 equation is about 7%, and that of the diffusion equation is about 13%. In other words, when the diffusion equation is satisfied, the P3 equation is more accurate than the diffusion equation at the peak value. When the absorption coefficient is high, and the detection distance is small, the reflectance error of the diffusion equation is about 30%. The transmittance error of the P3 equation is about 10%, and that of the diffusion equation is about 20%. It is further indicated that the reflectance and transmittance of the P3 equation are more accurate than those of the diffusion equation when the absorption coefficient is larger near the source. So the P3 time domain equation in a two-layer medium has an advantage over the diffusion equation.ConclusionsThe P3 time domain equation of light transmission in a two-layer slab medium is given. The P3 time domain equation is consistent with the Monte Carlo simulation results and is more accurate than the diffusion equation. So the diffusion equation of the two-layer medium can be replaced by the P3 time domain equation. When the optical parameters of the two layers are the same, a one-layer model can be derived. Therefore, the P3 equation in a two-layer slab medium not only includes the P3 equation in a one-layer slab medium but also lays the foundation for the P3 equation in a multi-layer slab medium. At present, the diffusion equation is used to extract the optical parameters of biological tissue, and the P3 equation in the one-layer medium is used to extract the optical parameters of biological tissue. Therefore, the P3 time domain diffusion equation in a two-layer medium can be used to extract the optical parameters of multi-layer media.
Acta Optica Sinica
- Publication Date: Jul. 10, 2023
- Vol. 43, Issue 13, 1320001 (2023)
Grouping Expansion Method of Packet Loss Data in Ghost Imaging
Bin Long, Yi Chen, Lunan Zhang, Maosheng Sun, Jiabao Li, and Haikuan Chang
In order to improve the practicability of compressed sensing ghost imaging and solve the problem of associative imaging failure caused by the loss of sampled data and the inability to repeat sampling in the scene, a expansion method of packet loss data in ghost imaging is proposed. First, the influences of different packet loss data on imaging performance are analyzed. Then, the image quality is improved by grouping the sample data and extending the sample results with missing phenomena. The simulation and experimental results show that, compared with the traditional method, the grouping expansion method can reduce the influence of packet loss data on the imaging quality, which is beneficial to further promote the practical application of ghost imaging. In order to improve the practicability of compressed sensing ghost imaging and solve the problem of associative imaging failure caused by the loss of sampled data and the inability to repeat sampling in the scene, a expansion method of packet loss data in ghost imaging is proposed. First, the influences of different packet loss data on imaging performance are analyzed. Then, the image quality is improved by grouping the sample data and extending the sample results with missing phenomena. The simulation and experimental results show that, compared with the traditional method, the grouping expansion method can reduce the influence of packet loss data on the imaging quality, which is beneficial to further promote the practical application of ghost imaging.
Acta Optica Sinica
- Publication Date: Mar. 24, 2022
- Vol. 42, Issue 7, 0720001 (2022)
Analysis of Infrared Polarization Characteristics of Target in Thermal Radiation Environment
Zhiyong Yang, Gaoxiang Lu, Zhiwei Zhang, and Junchen Song
Infrared polarization imaging technology has many advantages, such as improving target recognition rate and identifying camouflage targets, but the infrared polarization characteristics of targets are easy to be disturbed in complex environment, resulting in misjudgment and omission. To study the influence of ambient thermal radiation on the infrared polarization characteristics of the targets, the analytical model for the degree of infrared linear polarization of target surface under heat source irradiation is derived based on the polarization bidirectional reflection distribution function. Theoretical simulation and experimental verification show that the ambient thermal radiation will affect the infrared polarization characteristics of the targets. When the intensity of ambient thermal radiation is smaller than that of the target spontaneous thermal radiation, the degree of infrared linear polarization is negatively correlated with the intensity of ambient thermal radiation, which means the greater the intensity of ambient thermal radiation, the smaller the degree of infrared linear polarization. When the intensity of ambient thermal radiation is greater than that of the target spontaneous thermal radiation, the degree of infrared linear polarization is positively correlated with the intensity of ambient thermal radiation, which means the greater the intensity of ambient thermal radiation, the greater the degree of infrared linear polarization. The above results indicate that the degree of infrared linear polarization will change regularly when the targets are affected by external thermal radiation. Infrared polarization imaging technology has many advantages, such as improving target recognition rate and identifying camouflage targets, but the infrared polarization characteristics of targets are easy to be disturbed in complex environment, resulting in misjudgment and omission. To study the influence of ambient thermal radiation on the infrared polarization characteristics of the targets, the analytical model for the degree of infrared linear polarization of target surface under heat source irradiation is derived based on the polarization bidirectional reflection distribution function. Theoretical simulation and experimental verification show that the ambient thermal radiation will affect the infrared polarization characteristics of the targets. When the intensity of ambient thermal radiation is smaller than that of the target spontaneous thermal radiation, the degree of infrared linear polarization is negatively correlated with the intensity of ambient thermal radiation, which means the greater the intensity of ambient thermal radiation, the smaller the degree of infrared linear polarization. When the intensity of ambient thermal radiation is greater than that of the target spontaneous thermal radiation, the degree of infrared linear polarization is positively correlated with the intensity of ambient thermal radiation, which means the greater the intensity of ambient thermal radiation, the greater the degree of infrared linear polarization. The above results indicate that the degree of infrared linear polarization will change regularly when the targets are affected by external thermal radiation.
Acta Optica Sinica
- Publication Date: Dec. 27, 2021
- Vol. 42, Issue 2, 0220001 (2022)
Randomized Singular Value Decomposition Based on Optical Computation
Yaming Liu, Hongxiang Guo, Yanhu Chen, Jiajing Yang, Yi Guo, and Jian Wu
As randomized singular value decomposition (RSVD) is widely used in data compression, signal processing and image denoising, the increasing matrix scale puts forward higher requirements for the traditional computing platform. Therefore, a scheme of RSVD based on the spatial optical computation is proposed. The dimensions of a matrix are reduced by the inherent properties of the complex media, and there is no need to generate and store random Gaussian matrices. In this way, the computing overhead of RSVD can be effectively reduced. The experiment proves that the proposed scheme can achieve RSVD for a 80×80 matrix with a relative error of less than 0.1 when 220 mesh ground glass is used as a complex medium, the sampling rate is 0.2, and the dimension of macropixel block is 10×10. Compared with the traditional method, it effectively reduces the time complexity and space complexity of RSVD. Finally, the effect of the scheme is verified through image compression, which provides a basis for further research on large-scale image matrix algorithms. As randomized singular value decomposition (RSVD) is widely used in data compression, signal processing and image denoising, the increasing matrix scale puts forward higher requirements for the traditional computing platform. Therefore, a scheme of RSVD based on the spatial optical computation is proposed. The dimensions of a matrix are reduced by the inherent properties of the complex media, and there is no need to generate and store random Gaussian matrices. In this way, the computing overhead of RSVD can be effectively reduced. The experiment proves that the proposed scheme can achieve RSVD for a 80×80 matrix with a relative error of less than 0.1 when 220 mesh ground glass is used as a complex medium, the sampling rate is 0.2, and the dimension of macropixel block is 10×10. Compared with the traditional method, it effectively reduces the time complexity and space complexity of RSVD. Finally, the effect of the scheme is verified through image compression, which provides a basis for further research on large-scale image matrix algorithms.
Acta Optica Sinica
- Publication Date: Oct. 10, 2022
- Vol. 42, Issue 19, 1920002 (2022)
Topics
© Copyright 2018-2021 | Chinese Laser Press. All Rights Reserved 沪ICP备15018463号-20